


Mapping the Mind Through Code: Inside SuOn Academy’s Data Visualization Showcase in Computer Science
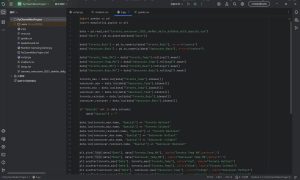
At SuOn Academy, computer science goes far beyond theory. In the Grade 12 ICS4U Computer Science classroom, students transformed abstract Python code into powerful tools for understanding the world, completing a creative journey from data to insight. By using professional tools such as NumPy, Pandas, Matplotlib, and Tkinter, students turned classroom learning into a stunning collection of data visualization projects—fully showcasing SuOn students’ exceptional logical reasoning and creative expression.
From Theory to Practice: When Data Meets Creativity
Grounded in the core curriculum, this project required students to work with real-world datasets and independently complete the entire process—from data cleaning and analysis to final visual presentation. It was not only a test of programming skills, but also a comprehensive exercise in logical thinking and problem-solving ability.
Solid Technical Foundations, Professional Tools
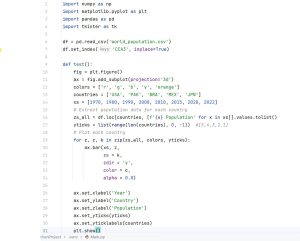
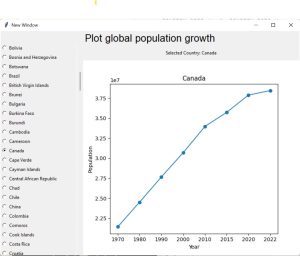
Students were expected to skillfully apply key libraries from the Python ecosystem. Pandas was used for data cleaning and organization, NumPy for efficient mathematical computation, and Matplotlib as the foundation for creating various types of charts. With the addition of Tkinter, students took a major step forward by building user-friendly graphical interfaces for their visualizations—moving from command-line programs to fully interactive applications.
Wide-Ranging Topics, Insightful Perspectives
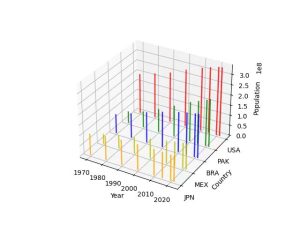
Based on their personal interests, students selected datasets covering a broad range of themes. From global climate change trends and movie box office analysis, to social media sentiment analysis and urban consumption studies, every project stemmed from careful observation of—and thoughtful reflection on—the real world.
Student Project Highlights
Let’s take a closer look at several standout projects to experience the creativity and insight behind the code:
Case Study 1:
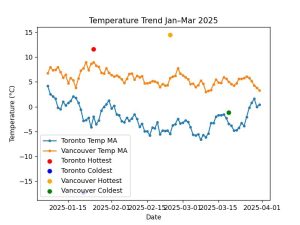
“Toronto vs. Vancouver: An Interactive Temperature Change Visualization”
By Win and Eric
Project Overview:
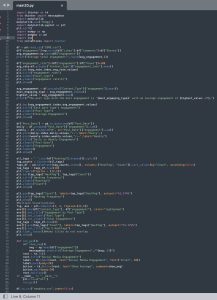
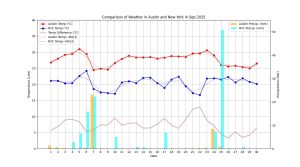
Using publicly available data from Environment Canada, the students created line charts showing monthly average temperature changes in Toronto and Vancouver over recent months. Beyond clearly visualizing seasonal fluctuations, they incorporated interactive controls using Tkinter, allowing users to filter data by specific years or quarters for deeper analysis. The project demonstrated strong technical execution while also prompting meaningful reflection on urban environmental change.
Case Study 2:
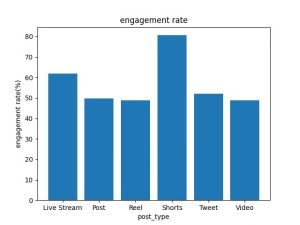
“Content Engagement Rates Across Global Online Social Platforms”
By Joe
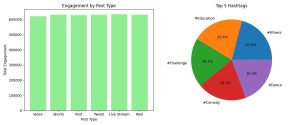
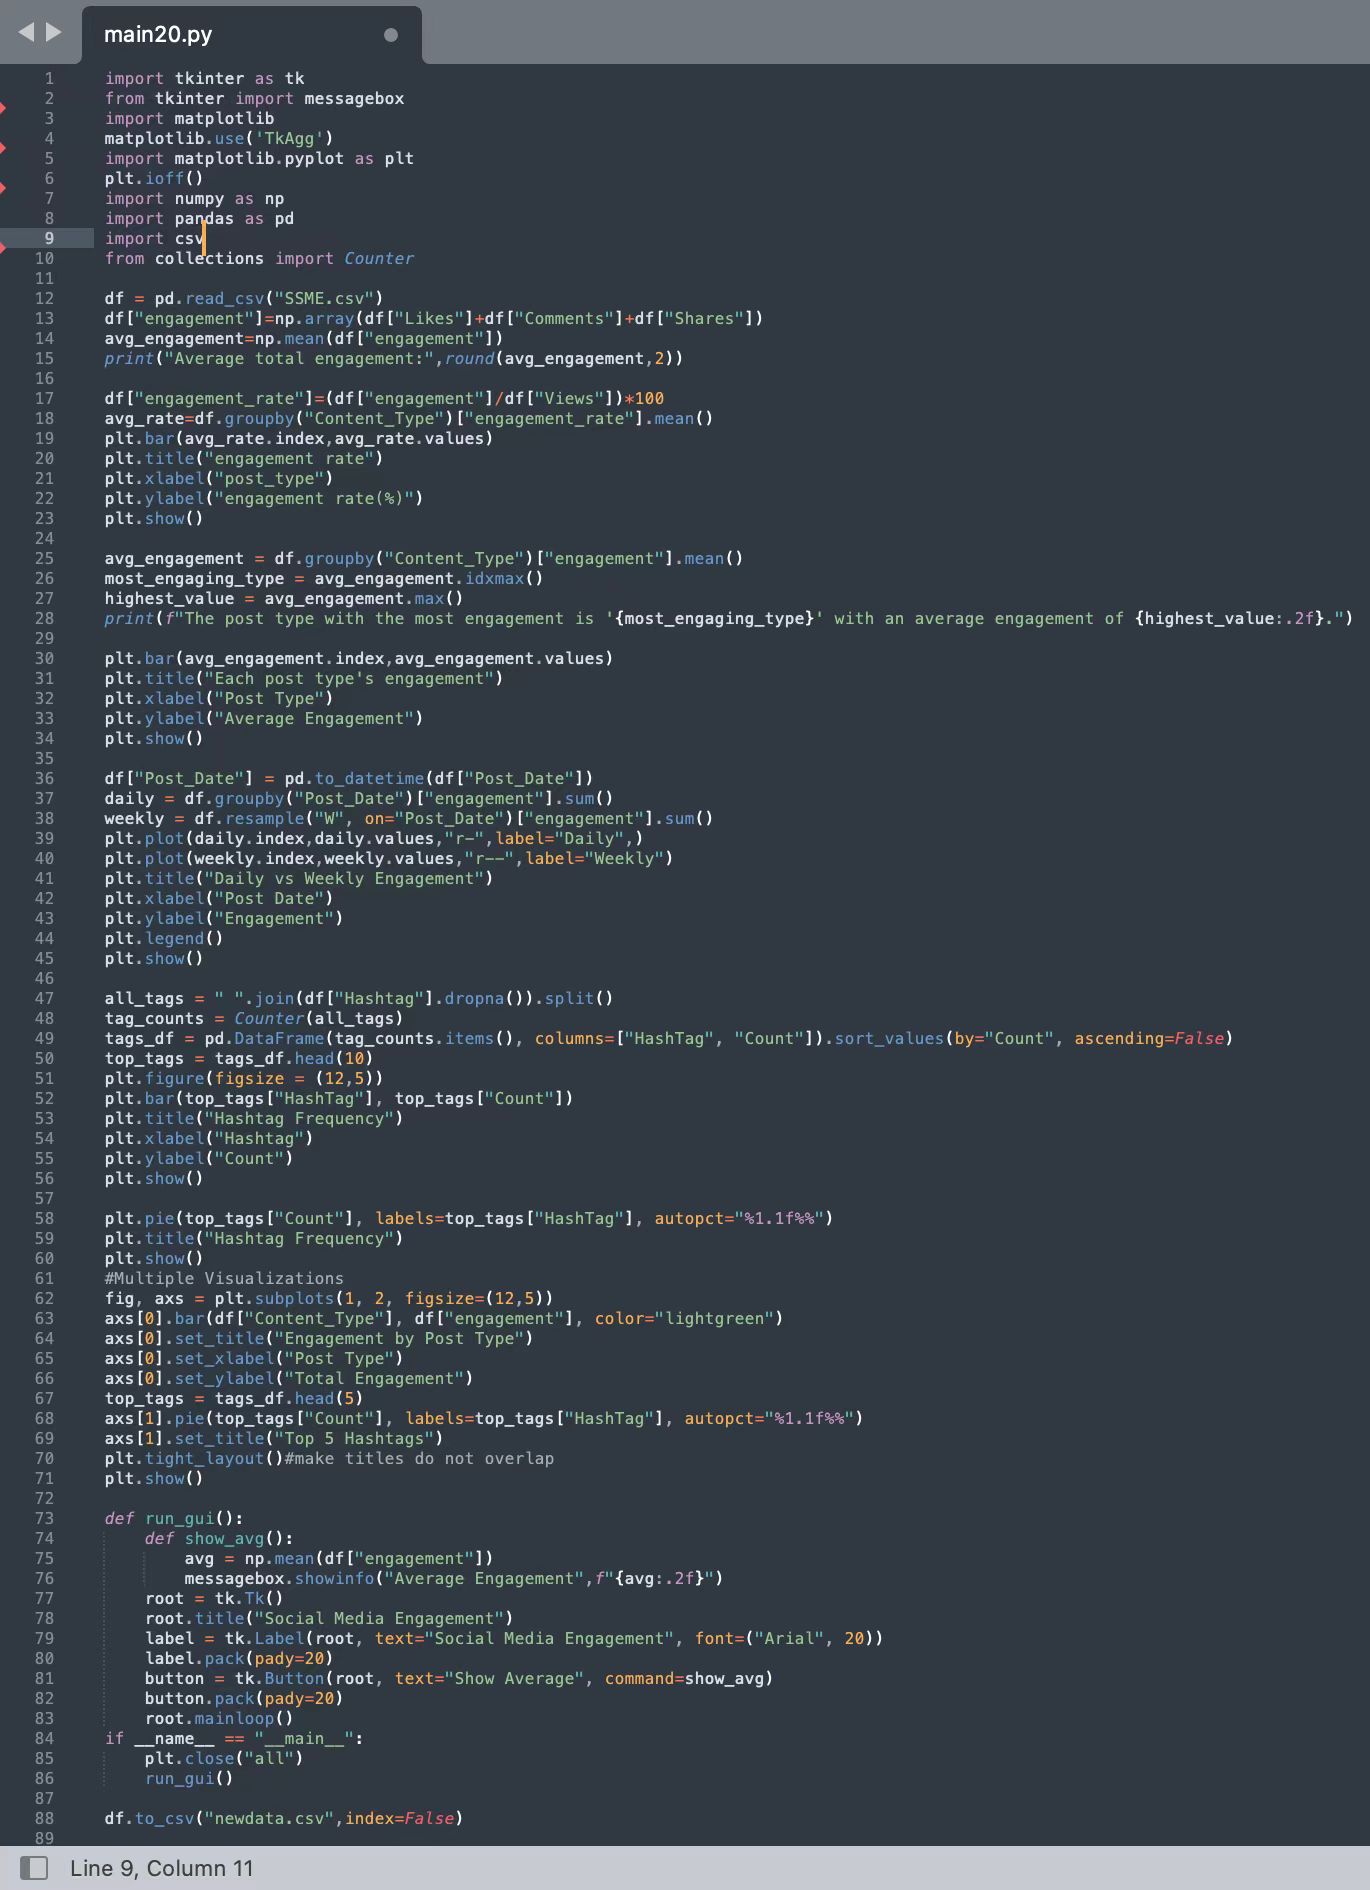
Using a compelling chart analyzing global social media content engagement rates, this project demonstrates how students transformed code into actionable insight. The visualization clearly shows that short videos (Shorts) and live streaming (Live Stream) dominate user engagement, with rates of 80% and 62% respectively, far surpassing traditional posts at 50%.
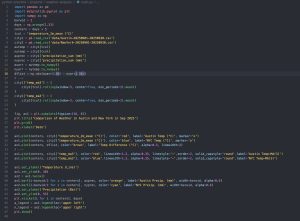
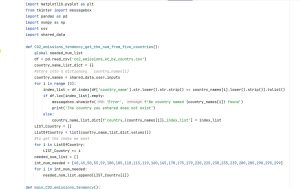
Behind this clear conclusion lies a rigorous data workflow. The student first used pandas to accurately read, filter, clean, and organize the dataset, ensuring the reliability of the analysis. Next, matplotlib was employed to define chart dimensions, label axes (such as post type and engagement rate (%)), and adjust bar colors and spacing—turning raw numbers into an intuitive visual narrative.
The result is a clean, high-contrast chart with a clear takeaway: short-form video content has a significant advantage in driving user engagement. More importantly, the project highlights SuOn students’ full end-to-end capability—from data acquisition and processing to visualization—and their potential to tell compelling business stories through data.
SuOn Computer Science Curriculum: Cultivating Future-Ready Problem Solvers
This ICS4U project is a powerful reflection of SuOn Academy’s philosophy of learning by doing. We believe that the true value of education lies in empowering students to apply knowledge to real-world problems.
Project-Based Learning
Through innovative project-based learning, students actively construct knowledge while tackling challenging tasks, developing critical thinking and creative problem-solving skills.
A University-Aligned Skill Set
The Python-based data analysis and visualization techniques taught in this course are precisely the core skills demanded by today’s universities and industries. By mastering these tools at the high school level, SuOn students gain a decisive advantage for both future university studies and their professional careers.
These elegant visualizations are more than just products of code—they are the crystallization of SuOn students’ curiosity, rigorous logic, and creativity. We are incredibly proud of what our students have accomplished.
Congratulations to all students in the Grade 12 ICS4U course!
 416-255-8808
 5 Queenslea Ave, Toronto, Ontario, Canada M9N 3X9


